 |
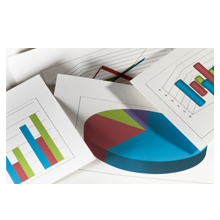
StatisticsWhat to see how your expo is doing in figures? Look no further than the built-in statistics feature which will record and display all the relevant data at your fingertips! See page visits and where your main expo traffic is happening. Use your statistics feature to see which areas of your expo would benefit from a tweak here and there to generate more interest. Receive feedback on your changes over time though regular and accessible monitoring. |
Expo Statistics Features
Find out how many visitors are accessing and viewing your expo, see reports from individual stands and follow visiting trends to various areas of your site. The built-in statistics feature makes it easy to keep track of how your site is going in the world of figures.
- Display statistics from and to dates you specify
- Monitor your different expo areas individually
- View results in both numbers and graphs for quick interpretation of how your expo is doing.
- Pie-charts with access to detailed information when clicked.
